Search
Close this search box.

TheFence

-50%

Ad cost

0.9%

CTR

73%

Conversion share

DATE:

July 12, 2021

MARTECH IN ACTION:

Facebook Ads, Frame.io, Slack, Asana, Databox, Google Analytics, Paperform

IN A NUTSHELL:

Main question of this experiment was this:

For Facebook ads, is the video format really worth it?

Find out how much money you may save on Facebook ads by using video… And as a bonus, discover the one unexpected benefit of using video ads…

01. Main takeaway

A video ad on Facebook incurs higher initial costs, which are justified in scenarios involving substantial advertising budgets or in advanced, competitive markets. While the click-through rate isn’t significantly higher compared to image ads, the Cost Per Click (CPC) for Facebook video ads can be as low as half of that for static image or carousel advertisements.

A surprising finding is that the higher engagement rate of Facebook video ads persists even on the landing page, leading to a notably higher quantity of leads, even in B2B contexts.

TheFence – Facebook video ads

SaaS Startup on the US market

IS FACEBOOK VIDEO ADVERTISING MORE EFFECTIVE THAN IMAGE-BASED FORMATS?

We produced an article about advertising trends at the start of the year, forecasting that video format will be a prominent feature in Facebook advertising trends for 2022. Since then, we have been conducting A/B tests across various advertising platforms for several clients to identify, on a market-by-market basis, which formats perform the best.

Traditional picture ad formats continue to do quite well for online stores, particularly when it comes to dynamic product ads. This time, though, we were interested in seeing where things are in the B2B sector.

In this case, we’re discussing the advertisement of a Hungarian company, TheFence‘s IT security SaaS product, in the context of driving traffic in the American market.

02. Mission of the ad

At this stage of the product lifecycle, when we are just entering the market, our main focus is on finding the right product-market fit (PMF) for the US market.

In this case, the average customer acquisition cost is a key performance indicator (KPI) since it has a major impact on pricing and the plan for developing an online business in the next few years.

Execution

We began the PMF testing with eight ad creatives and two landing pages, each with a double variation, in an effort to maximize cost-efficiency while maintaining a high value of speed-to-market.

Initially, we launched the advertisements on the most widespread pay-per-click channels, Google and Facebook, using standard search ads and Facebook video ad formats. (Plans for LinkedIn, Programmatic, and Spotify ads were in place for later stages, but due to rapid testing cycles, we focused on the aforementioned two platforms in the initial months.)

We generally targeted major US cities, excluding the fly-over states for the time being.

For the landing pages, we used Google Optimize to test a Hungarian and an American text for each distinct USP. The results came relatively quickly: US market + US copywriter = quick win.

Following this, we conducted landing page tests based on the product USP with the help of Google Optimize, directing traffic from search ads to the two pages. We evaluated which USP performed better based on micro and macro conversion settings.

This testing phase brought results a bit slower than we had originally planned, but after 3 weeks and with an 8% margin of error, we were finally able to settle on one version. (This means that we could potentially miss out on up to 8 leads out of 100 if it turns out we’re using the version that resonates less with the market—a risk deemed acceptable by management.)

03. The alternative path

Display Ads

Apart from search ads, we also ran quick, creative tests on Facebook’s system in the following way:

Our first round of creatives included a variety of static and carousel images. We made sure the system wasn’t biased towards the most popular video format by allowing picture ads to develop before working with videos. 

After a week, we added a video creative to the ad sets, featuring a meerkat anxiously watching a crowd running behind it. Here’s what that looked like:

04. Hypothesis

Before the PMF campaign, we operated with the following hypotheses:

  • From an advertising perspective, California and New York will perform the best.
  • Google Ads will outperform Facebook’s advertising system.
  • Cost reduction as a USP will perform better than a safety-focused call to action.
  • The performance of the Facebook video ad format will significantly outperform static creatives; despite image ads being uploaded and entered into the ad rotation earlier than the video.

05. Results

In terms of results, we usually start with examining soft conversions, such as click prices, click-through rates, frequency, micro-engagements, etc. These primarily serve to compare the performance of the set marketing funnel to industry averages.

Within a week, the Facebook video ad became the most frequently displayed format:

Out of 2118 clicks, 1845 came from the meerkat.

The average click cost (CPC) of static ads was between 4-5 dollars. (This seemingly high price is quite average in the US market.)

In contrast, the meerkat video brought in clicks at $2.1 each…

Facebook video ad experiment screenshot

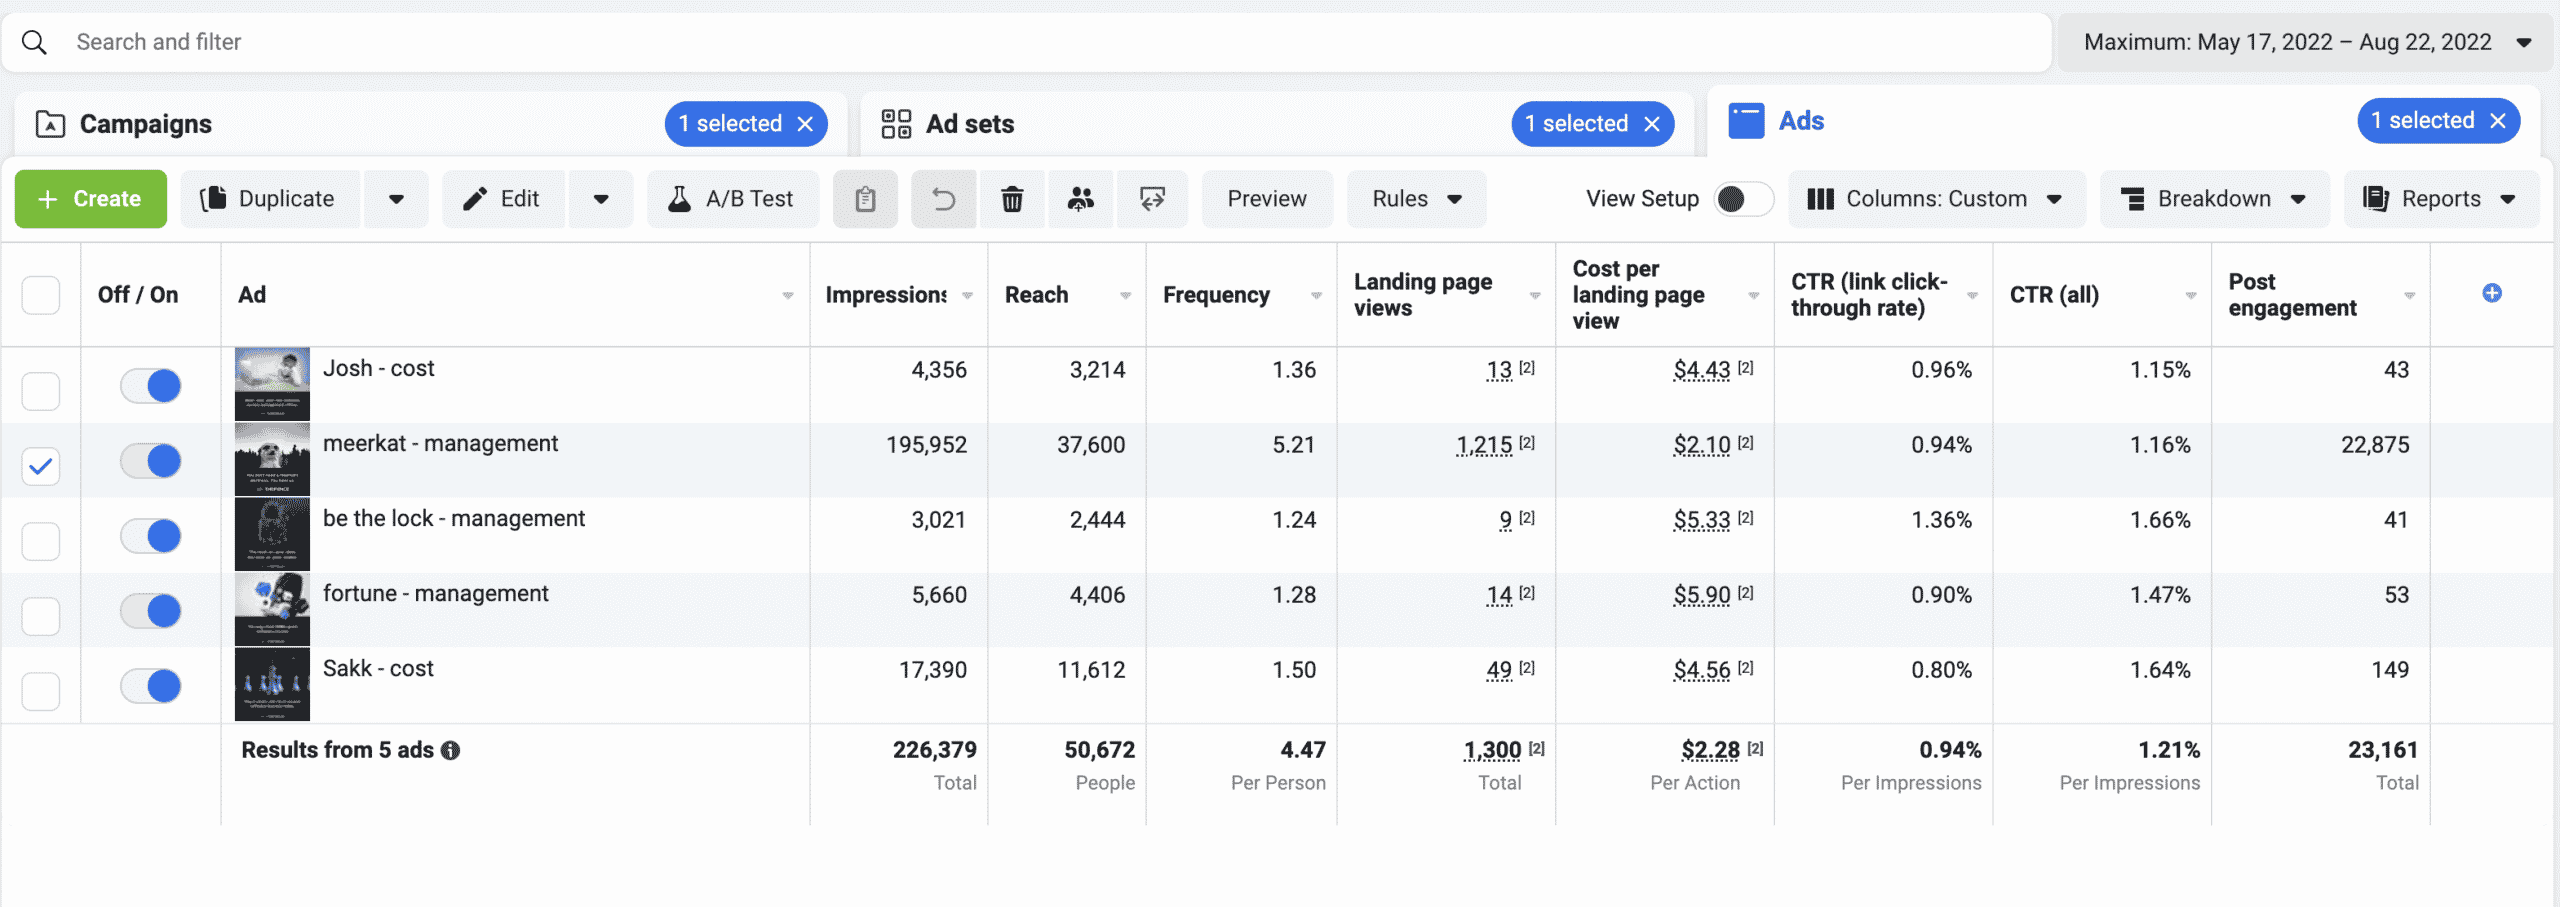
The click-through rate for static images was between 0.8 and 1.1%, with the meerkat bringing in 0.9%; in this, the Facebook video ad did not stand out from the performance produced by static images.

However, out of the 37 conversions received during the test, 27,

i.e., 73% of the conversions were brought in by the meerkat Facebook video ad.

The meerkat’s conversion rate was thus 1.4%, 0.3-0.4% better than other ads, so the meerkat came, saw, and conquered. Despite the system having a week to rotate the image ads, almost immediately after uploading the Facebook video ad, it started showing the moving image format most frequently.

In just one day, the click cost fell by more than half,

…resulting in increased ad traffic with the same spending limits, which led to an increase in conversion volume – not to mention that the effect persisted even on the landing page, and most conversions – on the same landing page – were due to the application of the Facebook video ad.

Looking for similar results?

If you’re wondering what we could achieve for your company, reach out to us and discover the kind of growth you can expect with the help of our veteran online agency.

AN ILLUSTRIOUS CLUB OF CLIENTS

Start the journey